使用JConsole监控应用系统
Figure 1 shows the architecture of J2SE 5.0 monitoring and management support. In the 5.0 release, the Java virtual machine (JVM) is highly instrumented for monitoring and management. The platform instrumentation provides information on performance, resource consumption, and the JVM and logging settings of applications running on the Java platform.
JMX provides a standard way to instrument the Java runtime environment and applications, and the JMX Remote API allows that instrumentation to be accessed remotely. The instrumentation is accessible through the JMX managed bean (MBean) interfaces, which are registered in the platform MBean server. Applications can also create their own MBeans and register them in the platform MBean server, which can serve as a single point for remote access. A JMX-compliant client, such as JConsole, can connect to the platform MBean server and manage the application (as well as the Java platform) using JMX technology. 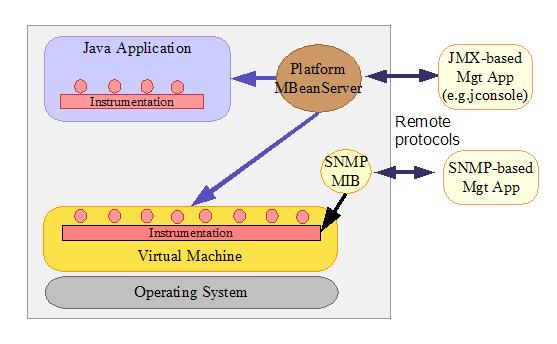
?
The Java platform provides a set of platform MBeans (Managed Beans) for monitoring and management of the Java virtual machine and the logging facility:
<!-- BEGIN VCD8 DATA TABLE COMPONENT --><!-- END VCD8 DATA TABLE COMPONENT -->JConsole is a JMX-compliant GUI tool that connects to a running JVM, which started with the management agent. To start an application with the management agent for local monitoring, set the com.sun.management.jmxremote system property when you start the application. For example, to enable the J2SE sample application Java2Demo for local monitoring, enter the following command:
???JDK_HOME/bin/java -Dcom.sun.management.jmxremote -jar JDK_HOME/demo/jfc/Java2D/Java2Demo.jar
where JDK_HOME is the directory containing the JDK 5.0. The Monitoring and Management Using JMX document provides detailed information on out-of-the-box remote management.
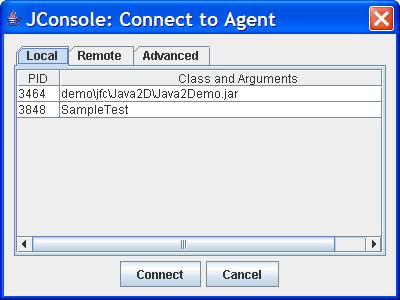
To start JConsole, run
???JDK_HOME/bin/jconsoleA connection dialog box opens, whose Local tab lists any JVMs running on the local system started with the same user ID as JConsole, along with their process ID and class/argument information.
?
?
Advanced. Connects to a JMX agent with the specified URL. You typically use this to connect to a JMX agent using a custom connector other than RMI connector, or an application running on JDK 1.4 with the Reference Implementation of JMX (JSR-3) and JMX Remote (JSR-160).
When JConsole successfully establishes the connection, it obtains information from the JVM MBeans in the connected JMX agent, and displays the information in the following tabs:
Summary tab. Summary information on the JVM and on monitored values. Memory tab. Information on memory use. Threads tab. Information on thread use. Classes tab. Information on class loading VM tab. Information on the JVM MBeans tab. Information on all MBeansThe MBeans tab displays information on all MBeans registered in the target JVM in a generic way. The MBeans tab allows you to access the full set of the platform instrumentation, including those that are not visible in the other tabs. Note that the other tabs present some of the information on the platform MBeans. In addition, you can monitor and manage your application's MBeans using this MBeans tab.
Using MBeans Tab to Monitor and Manage MBeansAll platform and application MBeans that are registered in the connected JMX agent can be accessed through the MBeans tab. For example, the Memory MBean is defined as follows:
?java.util.logging" domain. The format of an MBean object name is described in the javax.management.ObjectName specification.
When you select an MBean in the tree, its attributes, operations, notifications, and other information are displayed on the right. You can set the value of attributes, if they are writeable (the value is displayed in blue). You can invoke operations displayed in the Operations tab. You can also watch for the notifications emitted by an MBean: by default, JConsole does not listen to any notification emitted by an MBean until you subscribe to it. You can click the "Subscribe" button to subscribe to notifications or the "Unsubscribe" button to unsubscribe. 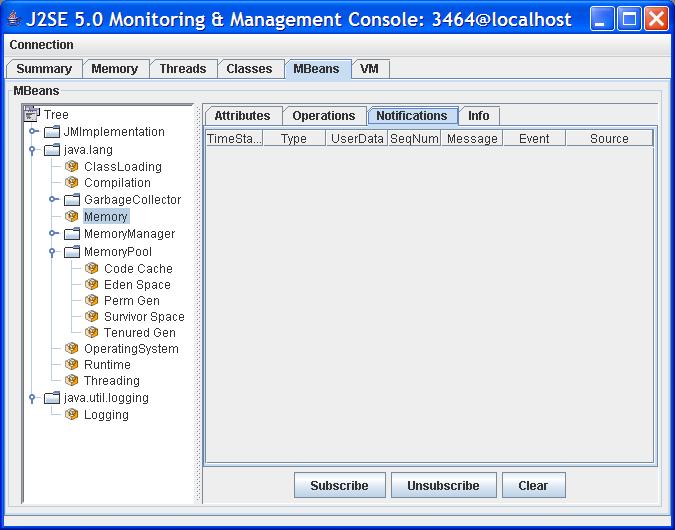
?
The Memory tab provides information about memory consumption, memory pools, and garbage collection statistics by accessing the memory system, memory pools, garbage collector MBeans.
?
The Details area shows several current memory metrics:
Used The amount of memory currently used. Memory used includes the memory occupied by all objects including both reachable and unreachable objects. Committed The amount of memory guaranteed to be available for use by the JVM. The amount of committed memory may change over time. The Java virtual machine may release memory to the system and committed could be less than the amount of memory initially allocated at startup. Committed will always be greater than or equal to used. Max The maximum amount of memory that can be used for memory management. Its value may change or be undefined. A memory allocation may fail if the JVM attempts to increase the used memory to be greater than committed memory, even if the amount used is less than or equal to max (for example, when the system is low on virtual memory). Usage Threshold The usage threshold of a memory pool. This field will only be shown if the memory pool supports usage threshold. GC time The cumulative time spent on garbage collection and the total number of invocations. It may have multiple rows, each of which represents one garbage collector algorithm used in the JVM.The bar chart on the lower right shows memory consumed by the memory pools in the JVM. The bar turns red when the memory used exceeds the usage threshold. The usage threshold is one of the attributes defined in the Memory Pool MBean for low memory detection support. A set of methods defined in the MemoryPoolMXBean interface for low memory detection support follows.
not useful but also might not be implemented efficiently.Collection Usage Threshold
Collection usage threshold is a manageable attribute of some garbage-collected memory pools. After a JVM has performed garbage collection on a memory pool, some memory in the pool will still be occupied by reachable objects. The collection usage threshold allows you to set a value to check against the memory usage only after garbage collection. If the JVM detects that the memory usage exceeds the collection usage threshold, it will set the CollectionUsageThresholdExceeded attribute to true.
You can use the CollectionUsageThresholdSupported attribute to determine if the pool supports a collection usage threshold.
The usage threshold and collection usage threshold is set in the MBeans tab. For example, select the TenuredGen memory pool in the left tree, set the usage threshold of the tenured generation memory pool to 6 Mbytes.
?
?
As described earlier, the memory system MBean defines a boolean attribute called Verbose that allows you to turn the GC verbose tracing on or off dynamically. The GC verbose traces will be displayed at the location specified at JVM startup. The default location for GC verbose output of the Hotspot virtual machine is stdout.
To enable or disable the GC verbose tracing, select the Memory MBean and set the Verbose attribute to true or false. Similarly, the class loading MBean also has the Verbose attribute, which can be set to enable or disable class loading verbose tracing. 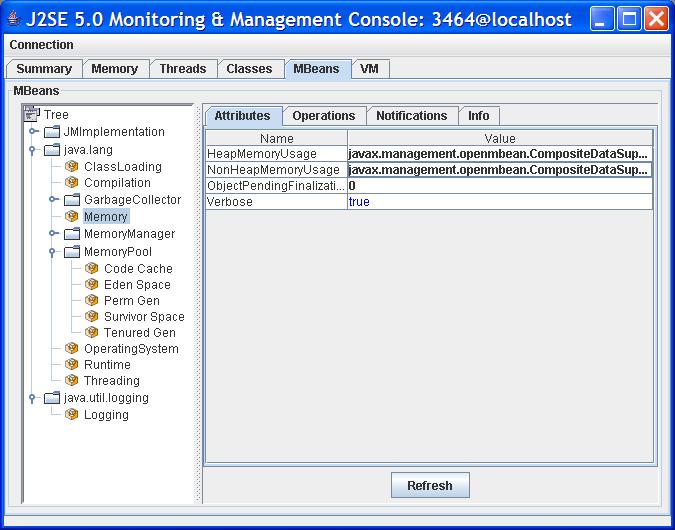
?
The Threads tab provides information about threads running in an application. 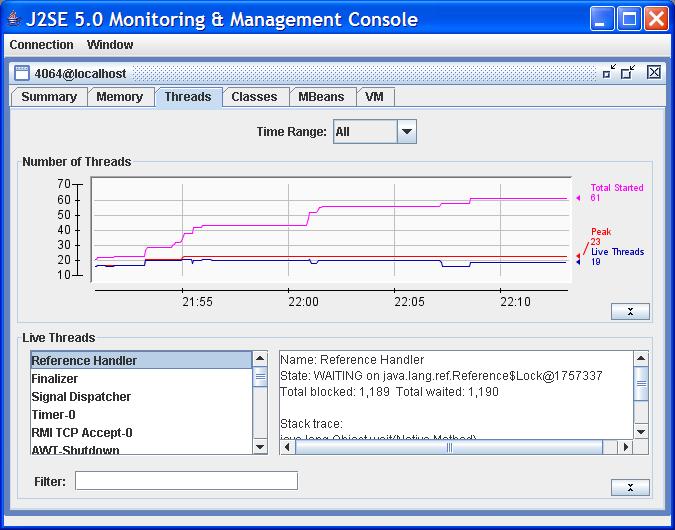
?
?
?
?
?
?
The Logging MBean defines a LoggerNames attribute describing the list of logger names. To find the list of loggers in your application, select the Logging MBean under the java.util.logging domain in the MBeans tree and then double-click on the value field of the LoggerNames attribute.
?
?
The JDK 5.0 extends the Operating System MBean to include certain OS resource information such as:
the process CPU time the amount of total and free physical memory the amount of committed virtual memory (that is, the amount of virtual memory guaranteed to be available to the running process) the amount of total and free swap space the number of open file descriptions (UNIX only)When the Operating System MBean in the MBeans tab is selected, you see all the attributes and operations including the platform extension. You can monitor the changes of a numerical attribute over time—for example, the process CPU time—by double-clicking the value field of the attribute.
?
The SampleTest application being monitored has its own Hello MBean with the object name:
???com.sun.example:type=HelloIf the CacheSize attribute is changed, the Hello MBean will send a notification. You can use the MBeans tab to manage your application's MBeans, as well as the platform MBeans. For example, you might want to monitor when the CacheSize attribute is changed. You first subscribe to the notifications in the Notification tab. If you change the CacheSize to
300, you will see one notification sent out.?
?
The JConsole tool demonstrates the comprehensiveness and ease-of use of the JDK 5.0's monitoring and management features. You can use JConsole to connect to a running Java virtual machine, and then monitor the memory usage and thread activity. You can obtain class-loading information, plus information on the JVM and the operating system. JConsole also gives you a generic way to access MBeans, such that you can access the full set of instrumentation of the Java platform and also manage your application.
We described how to access several core monitoring and management functionalities provided by the Java platform through JConsole, including low memory detection, virtual machine verbose tracing, deadlock detection, and logger level control.
Related InformationMonitoring and Management for the Java Platform Monitoring and Management Tools About the AuthorMandy Chung is a Senior Staff Engineer in the Java Serviceability Group at Sun Microsystems. She designed and implemented the JVM monitoring and management interface in JDK 5.0 and led the JConsole development. She holds a masters degree in Computer Science from the University of California, Davis, and a B.S. in Computer Studies from the University of Hong Kong.
===========================本文原始地址:
http://java.sun.com/developer/technicalArticles/J2SE/jconsole.html