JFreeChart时序曲线图
1.准备Jar包:jfreechart-1.0.13.jar和jcommon-1.0.16.jar
2.配置web.xml
<!-- JFreeChart --> <servlet> <servlet-name>DisplayChart</servlet-name> <servlet-class>org.jfree.chart.servlet.DisplayChart</servlet-class> </servlet> <servlet-mapping> <servlet-name>DisplayChart</servlet-name> <url-pattern>/DisplayChart</url-pattern> </servlet-mapping>
?
3.Action(Struts2)
?
/** * 曲线图 * */@SuppressWarnings("deprecation")public String quxiantu() throws Exception {String plateNum = request.getParameter("plateNum");String startDateTimeStr = request.getParameter("startTime");String stopDateTimeStr = request.getParameter("stopTime");List<Object[]> dataSet = mileageStatService.getVehicleFuelByPlateNum(plateNum, startDateTimeStr, stopDateTimeStr);//访问量统计时间线TimeSeries timeSeries = new TimeSeries(plateNum+"油耗统计", Minute.class);//时间曲线数据集合TimeSeriesCollection lineDataset = new TimeSeriesCollection(); //构造数据集合for(Object[] obj : dataSet){timeSeries.addOrUpdate(new Minute(dateformat.parse(obj[0].toString())), Long.valueOf(obj[1].toString()));}lineDataset.addSeries(timeSeries);//**************************************************************************************//解决中文乱码StandardChartTheme standardChartTheme = new StandardChartTheme("JFree"); //或者为Legacy standardChartTheme.setLargeFont(new Font("宋体", Font.BOLD, 12)); standardChartTheme.setRegularFont(new Font("宋体", Font.BOLD, 12)); standardChartTheme.setExtraLargeFont(new Font("宋体", Font.BOLD, 12)); standardChartTheme.setSmallFont(new Font("宋体", Font.BOLD, 12)); ChartFactory.setChartTheme(standardChartTheme); //**************************************************************************************JFreeChart chart = ChartFactory.createTimeSeriesChart("油耗统计时间线", "时间", "油耗", lineDataset, true, true, true); //***********************************************************************************XYPlot plot = chart.getXYPlot();//设置网格背景颜色plot.setBackgroundPaint(Color.white);//设置网格竖线颜色plot.setDomainGridlinePaint(Color.LIGHT_GRAY);//设置网格横线颜色plot.setRangeGridlinePaint(Color.LIGHT_GRAY);//设置曲线图与xy轴的距离plot.setAxisOffset(new RectangleInsets(0D, 0D, 0D, 10D));//设置X轴(日期轴)DateAxis dateaxis = (DateAxis) plot.getDomainAxis();//时间轴间距是5分钟,格式为小时:分钟dateaxis.setTickUnit(new DateTickUnit(DateTickUnit.MINUTE, 30));dateaxis.setDateFormatOverride(new SimpleDateFormat("yyyy-MM-dd HH:mm:ss"));//X轴日期垂直显示(没找到倾斜多少度显示)dateaxis.setVerticalTickLabels(true);//***********************************************************************************//设置子标题TextTitle subtitle = new TextTitle(startDateTimeStr+" 到 "+stopDateTimeStr, new Font("宋体", Font.PLAIN, 12));chart.addSubtitle(subtitle);//设置主标题chart.setTitle(new TextTitle(plateNum+"油耗统计", new Font("黑体", Font.BOLD, 15)));chart.setAntiAlias(true);String filename = ServletUtilities.saveChartAsPNG(chart, 700, 500, null, request.getSession());String graphURL = request.getContextPath() + "/DisplayChart?filename=" + filename;request.setAttribute("graphURL", graphURL);request.setAttribute("filename", filename);return "quxiantu";}?
4.jsp
?
<img src="${graphURL}" width="550" height="350" border="0" usemap="#${filename}" >?
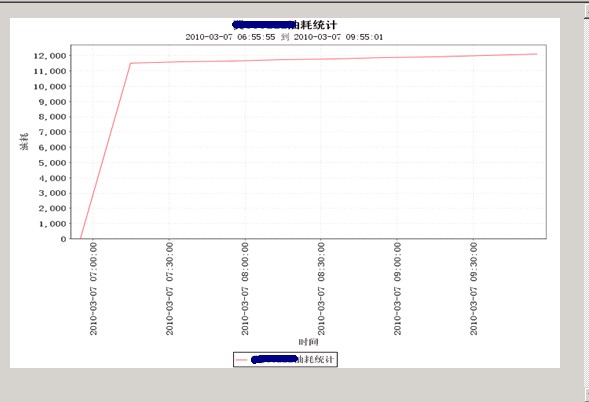
附图:
?