Rreporting services 中饼图显示top10
如何仅在饼图中显示top10,其他结果合并成"其他"项? 不在查询中合并,因为表格中要显示所有记录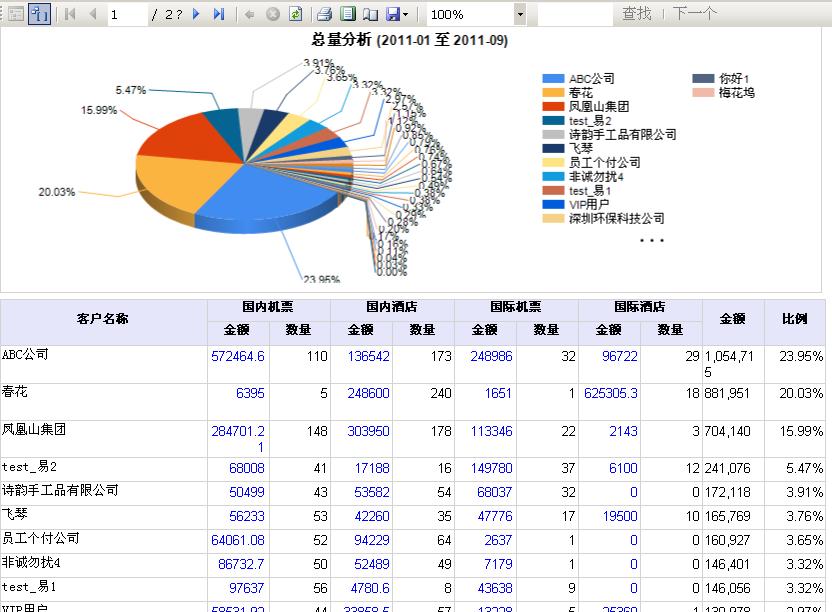
[解决办法]
将饼图上所有小于 5% 的切片组合为一个切片
打开“属性”窗格。
在设计图面上,单击饼图的任一切片。序列的属性将显示在“属性”窗格中。
在“常规”部分中,展开 CustomAttributes 节点。
将 CollectedStyle 属性设置为 SingleSlice。
将 CollectedThresholdUsePercent 属性设置为 True。
将 CollectedThreshold 属性设置为 5。