ASP.NET Chart Series Points AxisLabel 隔列显示 如何解决
想要解决的问题是:
如何全部显示出来?
问题:
在Y轴,每一条柱子下边的字符串都应该显示出来。
共13条柱子,也就是说共有13个字符串,然而现在只显示6个字符串。
原先13个字符串,每个字符串都是很长的,我以为是因为字符串太长导致其它字符串被挤下去,然后我就改成0,1,2,3,4,5,6,7...这些短的字符串代替测试,结果还是一样。
而我发现它是有规律的隔列显示,我以为是某个属性造成的,可是我找不到是哪个。
如图1: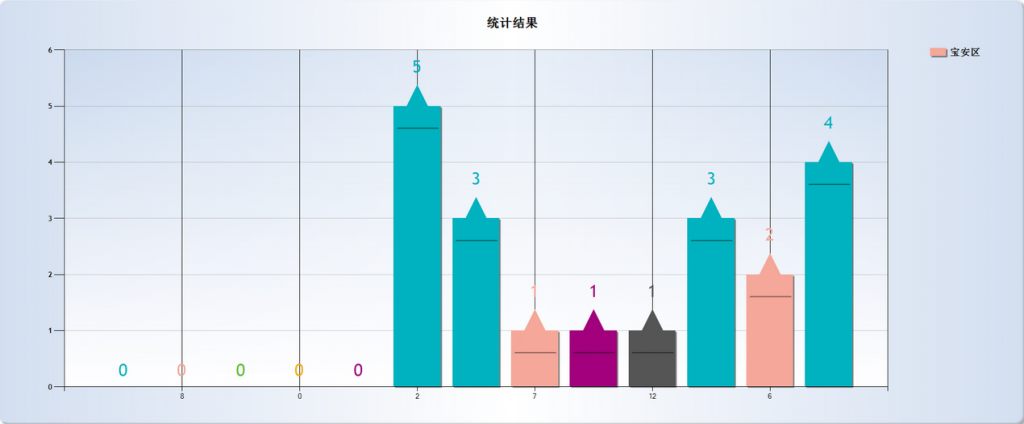
前置代码:
                        BackGradientStyle="TopBottom">
                        <Area3DStyle Rotation="10" Perspective="10" Inclination="15" IsRightAngleAxes="False"
                            WallWidth="0" IsClustered="False"></Area3DStyle>
                        <AxisY LineColor="64, 64, 64, 64">
                            <LabelStyle Font="Trebuchet MS, 12.5pt, style=Bold" />
                            <MajorGrid LineColor="64, 64, 64, 64" />
                        </AxisY>
                    </asp:ChartArea>
                </ChartAreas>
            </asp:Chart>
             </center>
    </div>
    </form>
</body>
</html>
后置代码:
using System;
using System.Collections.Generic;
using System.Linq;
using System.Web;
using System.Web.UI;
using System.Web.UI.WebControls;
using System.Xml;
using System.Web.UI.DataVisualization.Charting;

public partial class Result : System.Web.UI.Page
{
    protected void Page_Load(object sender, EventArgs e)
    {
        if (!IsPostBack)
        {
            Loading();
        }
    }

    /// <summary>
    /// 加载图表
    /// </summary>
    private void Loading()
    {
        //取消报表网格线
        //for (int x = 0; x < Chart1.ChartAreas.Count; x++)
        //{
        //    for (int y = 0; y < Chart1.ChartAreas[x].Axes.Length; y++)
        //    {
        //        Chart1.ChartAreas[x].Axes[y].MajorGrid.Enabled = false;
        //    }
        //}

        //初始化颜色键值表
        Dictionary<string, System.Drawing.Color> colorHash = new Dictionary<string, System.Drawing.Color>();
        colorHash.Add("宝安区", System.Drawing.Color.FromArgb(245,168,154));
        colorHash.Add("福田区", System.Drawing.Color.FromArgb(241,175,0));
        colorHash.Add("罗湖区", System.Drawing.Color.FromArgb(91,189,43));
        colorHash.Add("龙岗区", System.Drawing.Color.FromArgb(0,178,191));
        colorHash.Add("龙华新区", System.Drawing.Color.FromArgb(99,91,162));
        colorHash.Add("南山区", System.Drawing.Color.FromArgb(162,0,124));
        colorHash.Add("盐田区", System.Drawing.Color.FromArgb(85, 85, 85));

        //添加地区颜色对照表
        foreach (string item in colorHash.Keys)
        {
            Series ssss = new Series(item);
            ssss.Color = colorHash[item];
            ssss.BorderWidth = 7;
            ssss.ShadowOffset = 2;
            Chart1.Series.Add(ssss);
            break;
        }

        //设置图表类型
        Chart1.Series["宝安区"].Font = new System.Drawing.Font("Trebuchet MS", 24);
        //Chart1.Series["宝安区"].ChartType = SeriesChartType.Column;
        //Chart1.Series["宝安区"].PostBackValue = "#AXISLABEL" + ";#INDEX";

        //查询投票结果
        XmlNodeList xnList = this.GetXmlNodeList(@"/datas/Results/result");
        List<Results> rList = this.FindData(xnList);
        var query = from r in rList
                    group r by r.OprateId into g
                    select new
                    {
                        g.Key,
                        Count = g.Count()
                    };

        //查询所有地区
        XmlNodeList dataList = this.GetXmlNodeList(@"/datas/data");
        //初始化地区键值表
        Dictionary<int, XmlNode> dataHash = new Dictionary<int, XmlNode>();
        //封装地区键值表
        foreach (XmlNode item in dataList)
        {
            dataHash.Add(Convert.ToInt32(item.Attributes["id"].Value),item);
        }
        //移除未被选中的地区
        foreach (var q in query)
        {
            dataHash.Remove(q.Key);
        }

        //初始化所有投票结果集合
        List<PollResults> prList = new List<PollResults>();
        //封装未投票结果集合
        foreach (XmlNode item in dataHash.Values)
        {
            PollResults pr= new PollResults();
            pr.Count = 0;
            pr.Name = item.Attributes["name"].Value;
            pr.Type = item.Attributes["type"].Value;
            pr.OprateId = Convert.ToInt32(item.Attributes["id"].Value);
            prList.Add(pr);
        }
        //封装已投票结果集合
        foreach (var q in query)
        {
            PollResults pr = new PollResults();
            pr.Count = q.Count;
            XmlNode data = this.GetXmlNode(string.Format(@"/datas/data[@id={0}]", q.Key));
            pr.Name = data.Attributes["name"].Value;
            pr.Type = data.Attributes["type"].Value;
            pr.OprateId = q.Key;
            prList.Add(pr);
        }

        int i = 0;
        foreach (PollResults item in prList)
        {
            //Y轴数据
            Chart1.Series["宝安区"].Points.AddY(item.Count);
            //X轴显示的名称
            Chart1.Series["宝安区"].Points[i].AxisLabel = item.Name;
            //Chart1.Series["宝安区"].Points[i].Font = new System.Drawing.Font("Trebuchet MS", 20);
            //顶部显示的数字
            Chart1.Series["宝安区"].Points[i].Label = item.Count.ToString();
            //鼠标放上去的提示内容
            Chart1.Series["宝安区"].Points[i].ToolTip = item.Type;
            //设置柱子头标签文本颜色
            Chart1.Series["宝安区"].Points[i].LabelForeColor = colorHash[item.Type];
            //柱子颜色
            Chart1.Series["宝安区"].Points[i].Color = colorHash[item.Type];
            if (item.Count > 0)
            {
                Chart1.Series["宝安区"].Points[i].MarkerStyle = MarkerStyle.Triangle;//显示三角形
                Chart1.Series["宝安区"].Points[i].MarkerColor = colorHash[item.Type]; //三角形颜色
                Chart1.Series["宝安区"].Points[i].MarkerSize = 80;//三角形大小
            }
            i++;
        }

        //按照升序的方式排列
        //Chart1.Series["宝安区"].Sort(PointSortOrder.Ascending);
    }

    /// <summary>
    /// 封装Results数据集
    /// </summary>
    /// <param name="xnList"></param>
    /// <returns></returns>
    private List<Results> FindData(XmlNodeList xnList)
    {
        List<Results> rList = new List<Results>();
        foreach (XmlNode item in xnList)
        {
            Results r = new Results();
            r.Id = Convert.ToInt32(item.Attributes["id"].Value);
            r.IpAddress = item.Attributes["ip"].Value;
            r.OprateId = Convert.ToInt32(item.Attributes["oprateId"].Value);
            rList.Add(r);
        }
        return rList;
    }

    /// <summary>
    /// 获取节点集
    /// </summary>
    /// <param name="XPath"></param>
    /// <returns></returns>
    private XmlNodeList GetXmlNodeList(string XPath)
    {
        XmlDocument xd = new XmlDocument();
        string path = Server.MapPath(System.Configuration.ConfigurationManager.AppSettings["xmlPath"]);
        xd.Load(path);
        return xd.SelectNodes(XPath);
    }

    /// <summary>
    /// 获取节点
    /// </summary>
    /// <param name="XPath"></param>
    /// <returns></returns>
    private XmlNode GetXmlNode(string XPath)
    {
        XmlDocument xd = new XmlDocument();
        string path = Server.MapPath(System.Configuration.ConfigurationManager.AppSettings["xmlPath"]);
        xd.Load(path);
        return xd.SelectSingleNode(XPath);
    }
}
发文章发不了那么多字,我在回复里再发web.config和xml数据文件吧。
在此谢过各位了。
[解决办法]
chart控件有所了解 兄弟 你贴这么多代码谁看啊 为了四十分 看个半天
跟你说 你这个直接设置X轴最大最小值 和间隔多少就可以了
Chart1.ChartAreas[0].AxisX.Interval = 1;
自己多试试