【叨、校长】Android报表工具AChartEngine初探总结
AChartEngine?是一个安卓系统上制作图表的框架,目前它支持如下的图表类型:
?line chart (折线图)
?area chart (面积图;分区图,对比图)
?scatter chart ( 散点图)
?time chart (时间图;进度表)
?bar chart (条形图;柱状图)
?pie chart ( 饼图)
?bubble chart (气泡图)
?doughnut chart (圆环图)
?range (high-low) bar chart (范围条形图)
?dial chart / gauge (拨号盘/压力表)
?combined (any combination of line, cubic line, scatter, bar, range bar, bubble) chart(组合图)
?cubic line chart (立方折线图)
?
上述所有支持的图表类型,都可以包含多个系列,都支持水平(默认)或垂直方式展示图表,并且支持许多其他的自定义功能。所有图表都可以建立为一个view,也可以建立为一个用于启动activity的intent.
这个模型和绘图过程的代码进行了很好优化处理,它可以处理和显示值的数量非常大。
目前为止AchartEngine最新版是1.0.0版本。
?
以下代码基于1.0.0版本:?
?
?
1.0.0版本相对以前的使用简单了很多!代码也很简洁!
下面是我整理、摸索出来的使用方法:
折线图:
首先通过阅读官方代码可以发现有俩个很重要的类:
1、接口IDemoChart:
/** * Copyright (C) 2009, 2010 SC 4ViewSoft SRL * * Licensed under the Apache License, Version 2.0 (the "License"); * you may not use this file except in compliance with the License. * You may obtain a copy of the License at * * http://www.apache.org/licenses/LICENSE-2.0 * * Unless required by applicable law or agreed to in writing, software * distributed under the License is distributed on an "AS IS" BASIS, * WITHOUT WARRANTIES OR CONDITIONS OF ANY KIND, either express or implied. * See the License for the specific language governing permissions and * limitations under the License. */package org.achartengine.chartdemo.demo.chart;import android.content.Context;import android.content.Intent;/** * Defines the demo charts. */public interface IDemoChart { /** A constant for the name field in a list activity. */ String NAME = "name"; /** A constant for the description field in a list activity. */ String DESC = "desc"; /** * Returns the chart name. * * @return the chart name */ String getName(); /** * Returns the chart description. * * @return the chart description */ String getDesc(); /** * Executes the chart demo. * * @param context the context * @return the built intent */ Intent execute(Context context);}?
?
这个接口对实现chart图标的方法进行了抽象!
我们可以通过实现这个接口的方法来很方便的实现我们想要的Chart
在官方Demo中有一个类对此进行了实现、我们只要经常该类就可以很方便的实现我们自己的chart而不像之前版本那样的繁琐!
类AbstractDemoChart:
?
/** * Copyright (C) 2009, 2010 SC 4ViewSoft SRL * * Licensed under the Apache License, Version 2.0 (the "License"); * you may not use this file except in compliance with the License. * You may obtain a copy of the License at * * http://www.apache.org/licenses/LICENSE-2.0 * * Unless required by applicable law or agreed to in writing, software * distributed under the License is distributed on an "AS IS" BASIS, * WITHOUT WARRANTIES OR CONDITIONS OF ANY KIND, either express or implied. * See the License for the specific language governing permissions and * limitations under the License. */package org.achartengine.chartdemo.demo.chart;import java.util.Date;import java.util.List;import org.achartengine.chart.PointStyle;import org.achartengine.model.CategorySeries;import org.achartengine.model.MultipleCategorySeries;import org.achartengine.model.TimeSeries;import org.achartengine.model.XYMultipleSeriesDataset;import org.achartengine.model.XYSeries;import org.achartengine.renderer.DefaultRenderer;import org.achartengine.renderer.SimpleSeriesRenderer;import org.achartengine.renderer.XYMultipleSeriesRenderer;import org.achartengine.renderer.XYSeriesRenderer;/** * An abstract class for the demo charts to extend. It contains some methods for * building datasets and renderers. */public abstract class AbstractDemoChart implements IDemoChart { /** * Builds an XY multiple dataset using the provided values. * * @param titles the series titles * @param xValues the values for the X axis * @param yValues the values for the Y axis * @return the XY multiple dataset */ protected XYMultipleSeriesDataset buildDataset(String[] titles, List<double[]> xValues, List<double[]> yValues) { XYMultipleSeriesDataset dataset = new XYMultipleSeriesDataset(); addXYSeries(dataset, titles, xValues, yValues, 0); return dataset; } public void addXYSeries(XYMultipleSeriesDataset dataset, String[] titles, List<double[]> xValues, List<double[]> yValues, int scale) { int length = titles.length; for (int i = 0; i < length; i++) { XYSeries series = new XYSeries(titles[i], scale); double[] xV = xValues.get(i); double[] yV = yValues.get(i); int seriesLength = xV.length; for (int k = 0; k < seriesLength; k++) { series.add(xV[k], yV[k]); } dataset.addSeries(series); } } /** * Builds an XY multiple series renderer. * * @param colors the series rendering colors * @param styles the series point styles * @return the XY multiple series renderers */ protected XYMultipleSeriesRenderer buildRenderer(int[] colors, PointStyle[] styles) { XYMultipleSeriesRenderer renderer = new XYMultipleSeriesRenderer(); setRenderer(renderer, colors, styles); return renderer; } protected void setRenderer(XYMultipleSeriesRenderer renderer, int[] colors, PointStyle[] styles) { renderer.setAxisTitleTextSize(16); renderer.setChartTitleTextSize(20); renderer.setLabelsTextSize(15); renderer.setLegendTextSize(15); renderer.setPointSize(5f); renderer.setMargins(new int[] { 20, 30, 15, 20 }); int length = colors.length; for (int i = 0; i < length; i++) { XYSeriesRenderer r = new XYSeriesRenderer(); r.setColor(colors[i]); r.setPointStyle(styles[i]); renderer.addSeriesRenderer(r); } } /** * Sets a few of the series renderer settings. * * @param renderer the renderer to set the properties to * @param title the chart title * @param xTitle the title for the X axis * @param yTitle the title for the Y axis * @param xMin the minimum value on the X axis * @param xMax the maximum value on the X axis * @param yMin the minimum value on the Y axis * @param yMax the maximum value on the Y axis * @param axesColor the axes color * @param labelsColor the labels color */ protected void setChartSettings(XYMultipleSeriesRenderer renderer, String title, String xTitle, String yTitle, double xMin, double xMax, double yMin, double yMax, int axesColor, int labelsColor) { renderer.setChartTitle(title); renderer.setXTitle(xTitle); renderer.setYTitle(yTitle); renderer.setXAxisMin(xMin); renderer.setXAxisMax(xMax); renderer.setYAxisMin(yMin); renderer.setYAxisMax(yMax); renderer.setAxesColor(axesColor); renderer.setLabelsColor(labelsColor); } /** * Builds an XY multiple time dataset using the provided values. * * @param titles the series titles * @param xValues the values for the X axis * @param yValues the values for the Y axis * @return the XY multiple time dataset */ protected XYMultipleSeriesDataset buildDateDataset(String[] titles, List<Date[]> xValues, List<double[]> yValues) { XYMultipleSeriesDataset dataset = new XYMultipleSeriesDataset(); int length = titles.length; for (int i = 0; i < length; i++) { TimeSeries series = new TimeSeries(titles[i]); Date[] xV = xValues.get(i); double[] yV = yValues.get(i); int seriesLength = xV.length; for (int k = 0; k < seriesLength; k++) { series.add(xV[k], yV[k]); } dataset.addSeries(series); } return dataset; } /** * Builds a category series using the provided values. * * @param titles the series titles * @param values the values * @return the category series */ protected CategorySeries buildCategoryDataset(String title, double[] values) { CategorySeries series = new CategorySeries(title); int k = 0; for (double value : values) { series.add("Project " + ++k, value); } return series; } /** * Builds a multiple category series using the provided values. * * @param titles the series titles * @param values the values * @return the category series */ protected MultipleCategorySeries buildMultipleCategoryDataset(String title, List<String[]> titles, List<double[]> values) { MultipleCategorySeries series = new MultipleCategorySeries(title); int k = 0; for (double[] value : values) { series.add(2007 + k + "", titles.get(k), value); k++; } return series; } /** * Builds a category renderer to use the provided colors. * * @param colors the colors * @return the category renderer */ protected DefaultRenderer buildCategoryRenderer(int[] colors) { DefaultRenderer renderer = new DefaultRenderer(); renderer.setLabelsTextSize(15); renderer.setLegendTextSize(15); renderer.setMargins(new int[] { 20, 30, 15, 0 }); for (int color : colors) { SimpleSeriesRenderer r = new SimpleSeriesRenderer(); r.setColor(color); renderer.addSeriesRenderer(r); } return renderer; } /** * Builds a bar multiple series dataset using the provided values. * * @param titles the series titles * @param values the values * @return the XY multiple bar dataset */ protected XYMultipleSeriesDataset buildBarDataset(String[] titles, List<double[]> values) { XYMultipleSeriesDataset dataset = new XYMultipleSeriesDataset(); int length = titles.length; for (int i = 0; i < length; i++) { CategorySeries series = new CategorySeries(titles[i]); double[] v = values.get(i); int seriesLength = v.length; for (int k = 0; k < seriesLength; k++) { series.add(v[k]); } dataset.addSeries(series.toXYSeries()); } return dataset; } /** * Builds a bar multiple series renderer to use the provided colors. * * @param colors the series renderers colors * @return the bar multiple series renderer */ protected XYMultipleSeriesRenderer buildBarRenderer(int[] colors) { XYMultipleSeriesRenderer renderer = new XYMultipleSeriesRenderer(); renderer.setAxisTitleTextSize(16); renderer.setChartTitleTextSize(20); renderer.setLabelsTextSize(15); renderer.setLegendTextSize(15); int length = colors.length; for (int i = 0; i < length; i++) { SimpleSeriesRenderer r = new SimpleSeriesRenderer(); r.setColor(colors[i]); renderer.addSeriesRenderer(r); } return renderer; }}?
?
通过阅读这个类的源码我们可以发现、对Chart实现了封装!我们只要简单的继承该类、重写以下方法即可实现我们自己的Chart!如下代码所示:折线图的实现:
这是我自己的一个业务Chart实现:
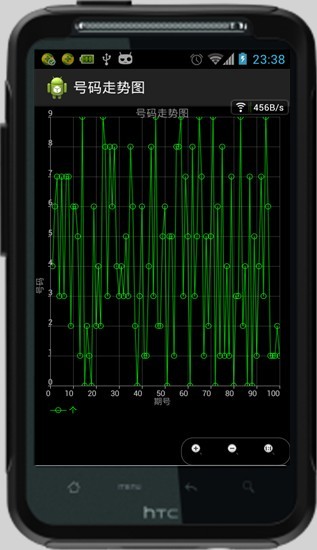
package com.example.shishi;import java.util.ArrayList;import java.util.HashMap;import org.achartengine.ChartFactory;import org.achartengine.chart.AbstractChart;import org.achartengine.chart.PointStyle;import org.achartengine.chartdemo.demo.chart.AbstractDemoChart;import org.achartengine.renderer.XYMultipleSeriesRenderer;import com.example.service.GetSSCDate;import com.example.service.GetSSCDate.DateStruct;import android.content.Context;import android.content.Intent;import android.graphics.Color;import android.graphics.Paint.Align;public class ShishiTrendChart extends AbstractDemoChart {private int _type;private ArrayList<String> _data;/** * 构造方法可以实现自定义的初始化工作:如:数据的获得 * @param type * @param data */public ShishiTrendChart(int type,ArrayList<String> data) {this._data =data;this._type=type;}@Overridepublic String getName() {return "号码走势图";}@Overridepublic String getDesc() {return null;}@Overridepublic Intent execute(Context context) {String[] legends = { "万", "千", "百", "十", "个" };// 图例名称数组String[] legend =new String[_type];// 图例名称数组for(int i=0;i<_type;i++){legend[i]=legends[4-i];}ArrayList<double[]> x = new ArrayList<double[]>();ArrayList<double[]> y = new ArrayList<double[]>();int size = _data.size();for(int j=0;j<legend.length;j++){//有几条曲线、就有几个x轴double[] xValues = new double[100];for (int i = 0; i < 100; i++) {xValues[i] = i + 1;}x.add(xValues);}for (int i = 1; i <= _type; i++) {//有几条曲线、就有几个y轴的坐标double[] yValues = new double[100];for (int j = 0; j < size; j++) {yValues[j] = getNum(_data.get(j), i);}y.add(yValues);}int[] color = new int[] { Color.GRAY, Color.GREEN, Color.CYAN,Color.YELLOW, Color.GREEN };// 设置每条曲线的颜色 默认是5条int[] colors =new int[_type];// 实际曲线数量for(int i=0;i<_type;i++){colors[i]=color[4-i];}PointStyle[] style = new PointStyle[] { PointStyle.POINT,PointStyle.DIAMOND, PointStyle.TRIANGLE, PointStyle.SQUARE,PointStyle.CIRCLE };//设置默认曲线的点的形状PointStyle[] styles =new PointStyle[_type];// 实际曲线for(int i=0;i<_type;i++){styles[i]=style[4-i];}XYMultipleSeriesRenderer renderer = buildRenderer(colors, styles);//setChartSettings(renderer, getName(), "期号", "号码", 0, 100, 0, 9,Color.GRAY, Color.GRAY);renderer.setXLabels(10);// 设置x轴显示10个点,根据setChartSettings的最大值和最小值自动计算点的间隔renderer.setYLabels(10);// 设置y轴显示10个点,根据setChartSettings的最大值和最小值自动计算点的间隔renderer.setShowGrid(true);// 是否显示网格renderer.setApplyBackgroundColor(true);renderer.setBackgroundColor(Color.BLACK);renderer.setMarginsColor(Color.BLACK);renderer.setXLabelsAlign(Align.RIGHT);// 刻度线与刻度标注之间的相对位置关系renderer.setYLabelsAlign(Align.CENTER);// 刻度线与刻度标注之间的相对位置关系renderer.setZoomButtonsVisible(true);// 是否显示放大缩小按钮renderer.setPanLimits(new double[] { 0, 100, -1, 10 }); // 设置拖动时X轴Y轴允许的最大值最小值.//renderer.setZoomLimits(new double[] { 0, 100, -10, 20 });// 设置放大缩小时X轴Y轴允许的最大最小值.Intent intent = ChartFactory.getLineChartIntent(context,buildDataset(legend, x, y), renderer,getName());// 构建Intentreturn intent;}public double getNum(String s, int i) {s = s.split(",")[5-i];return Double.parseDouble(s);}}?这样的代码是不是比以前版本的实现清晰、简洁了很多!
?
以上代码根据官方实例得出!所以务必要写入官方的俩个实现类:public interface IDemoChart,public abstract class AbstractDemoChart implements IDemoChart这俩个类官方源码已经给出!复制到自己的项目当中就行!
对于饼图、柱状图就更简单了!
参考下列代码:
饼图:
package org.achartengine.chartdemo.demo.chart;import org.achartengine.ChartFactory;import org.achartengine.renderer.DefaultRenderer;import android.content.Context;import android.content.Intent;import android.graphics.Color;public class BudgetPieChart extends AbstractDemoChart { public String getName() { return "Budget chart"; } public String getDesc() { return "The budget per project for this year (pie chart)"; } public Intent execute(Context context) { double[] values = new double[] { 12, 14, 11, 10, 19 };//饼图分层5块,每块代表的数值 int[] colors = new int[] { Color.BLUE, Color.GREEN, Color.MAGENTA, Color.YELLOW, Color.CYAN };//每块饼图的颜色 DefaultRenderer renderer = buildCategoryRenderer(colors); renderer.setZoomButtonsVisible(true);//设置显示放大缩小按钮 renderer.setZoomEnabled(true);//设置允许放大缩小. renderer.setChartTitleTextSize(20);//设置图表标题的文字大小 return ChartFactory.getPieChartIntent(context, buildCategoryDataset("Project budget", values), renderer, "Budget");//构建Intent, buildCategoryDataset是调用AbstraDemoChart的构建方法. }}?柱状图:
?
package org.achartengine.chartdemo.demo.chart;import java.util.ArrayList;import java.util.List;import org.achartengine.ChartFactory;import org.achartengine.chart.BarChart.Type;import org.achartengine.renderer.XYMultipleSeriesRenderer;import android.content.Context;import android.content.Intent;import android.graphics.Color;import android.graphics.Paint.Align;public class SalesStackedBarChart extends AbstractDemoChart { public String getName() { return "Sales stacked bar chart"; } public String getDesc() { return "The monthly sales for the last 2 years (stacked bar chart)"; } public Intent execute(Context context) { String[] titles = new String[] { "2008", "2007" };//图例 List<double[]> values = new ArrayList<double[]>(); values.add(new double[] { 14230, 12300, 14240, 15244, 15900, 19200, 22030, 21200, 19500, 15500, 12600, 14000 });//第一种柱子的数值 values.add(new double[] { 5230, 7300, 9240, 10540, 7900, 9200, 12030, 11200, 9500, 10500, 11600, 13500 });//第二中柱子的数值 int[] colors = new int[] { Color.BLUE, Color.CYAN };//两种柱子的颜色 XYMultipleSeriesRenderer renderer = buildBarRenderer(colors);//调用AbstractDemoChart中的方法构建renderer. setChartSettings(renderer, "Monthly sales in the last 2 years", "Month", "Units sold", 0.5, 12.5, 0, 24000, Color.GRAY, Color.LTGRAY);//调用AbstractDemoChart中的方法设置renderer的一些属性. renderer.getSeriesRendererAt(0).setDisplayChartValues(true);//设置柱子上是否显示数量值 renderer.getSeriesRendererAt(1).setDisplayChartValues(true);//设置柱子上是否显示数量值 renderer.setXLabels(12);//X轴的近似坐标数 renderer.setYLabels(5);//Y轴的近似坐标数 renderer.setXLabelsAlign(Align.LEFT);//刻度线与X轴坐标文字左侧对齐 renderer.setYLabelsAlign(Align.LEFT);//Y轴与Y轴坐标文字左对齐 renderer.setPanEnabled(true, false);//允许左右拖动,但不允许上下拖动. // renderer.setZoomEnabled(false); renderer.setZoomRate(1.1f);//放大的倍率 renderer.setBarSpacing(0.5f);//柱子间宽度 return ChartFactory.getBarChartIntent(context, buildBarDataset(titles, values), renderer, Type.STACKED);//构建Intent, buildBarDataset是调用AbstractDemochart中的方法. }}?可以发现都是继承了抽象类AbstractDemoChart而实现的!
?
很简单吧!
以下是一些技巧:
如何设置背景色:
renderer.setApplyBackgroundColor(true);//是否可以自定义背景色renderer.setBackgroundColor(Color.BLACK); //chart内部的背景色renderer.setMarginsColor(Color.BLACK);//chart边缘部分的背景色
?以上所述由校长整理、研究所得!
?
?
?
?
1 楼 xiaozhi6156 2013-05-01 更想看到的是图 2 楼 wb1991wb 2013-05-01 xiaozhi6156 写道更想看到的是图哈哈、百度一下你就会看AChartEngine官方Demo的实例图了!
我也上传了一个自己的图!
3 楼 sunsdw 2013-05-08 我用了你的曲线图,感觉你根据逗号截取的时候好像不对啊,还是要传什么固定格式的,我开始传的是1,2,3,但是不行,后来把你split那块去掉了,好使了,但是曲线明显不对啊,感觉你这块写的还不如官网的例子...其他部分都是一样的... 4 楼 wb1991wb 2013-05-15 sunsdw 写道我用了你的曲线图,感觉你根据逗号截取的时候好像不对啊,还是要传什么固定格式的,我开始传的是1,2,3,但是不行,后来把你split那块去掉了,好使了,但是曲线明显不对啊,感觉你这块写的还不如官网的例子...其他部分都是一样的...
我的曲线图只适合我的业务逻辑!