【D3.V3.js系列教程】--(五)用层画条形图
【D3.V3.js系列教程】--(五)用层画条形图1、为同类层添加样式
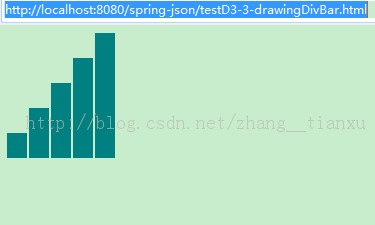
div.bar { display: inline-block; width: 20px; height: 75px; /* We'll override this later */ background-color: teal;}.attr("class", "bar").style("height", function(d) { var barHeight = d * 5; //Scale up by factor of 5 return barHeight + "px";});margin-right: 2px;<!DOCTYPE html><html> <head><meta charset="utf-8"><title>testD3-3-drawingDivBar</title><script type="text/javascript" src="http://localhost:8080/spring/js/d3.v3.js"></script><style type="text/css">div.bar {display: inline-block;width: 20px;height: 75px;/* Gets overriden by D3-assigned height below */margin-right: 2px;background-color: teal;}</style></head><body><script type="text/javascript">var dataset = [ 5, 10, 15, 20, 25 ];d3.select("body").selectAll("div").data(dataset).enter().append("div").attr("class", "bar").style("height", function(d) {var barHeight = d * 5;return barHeight + "px";});</script></body></html>