【D3.V3.js系列教程】--(十三)轴
【D3.V3.js系列教程】--(十三)轴1、定义和创建X轴
//Define X axis
var xAxis = d3.svg.axis()
.scale(xScale)
.orient("bottom");
//Create X axis
svg.append("g")
.call(xAxis);
效果:
变成刻度尺:
.axis path,.axis line { fill: none; stroke: black; shape-rendering: crispEdges;}.axis text { font-family: sans-serif; font-size: 11px;}
调整坐标位置到下面:
svg.append("g") .attr("class", "axis") .attr("transform", "translate(0," + (h - padding) + ")") .call(xAxis);效果:
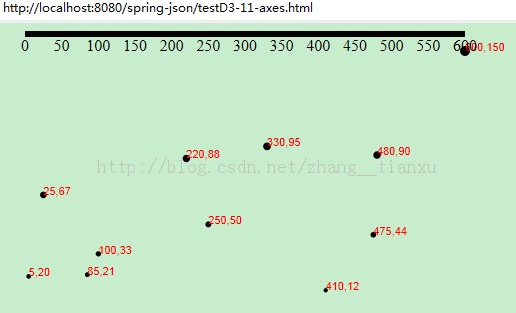
var xAxis = d3.svg.axis() .scale(xScale) .orient("bottom") .ticks(5); //Set rough # of ticks效果: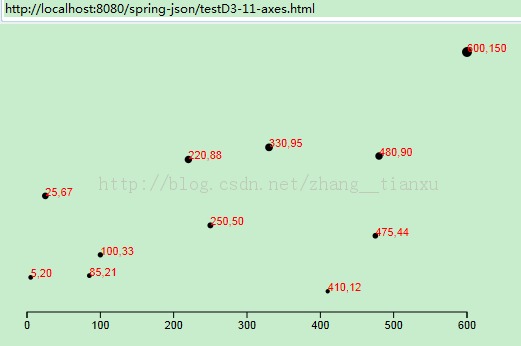

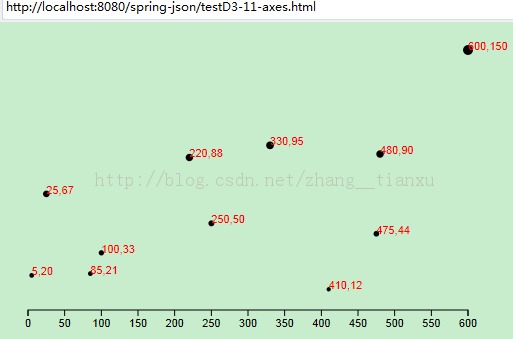
//Define Y axisvar yAxis = d3.svg.axis() .scale(yScale) .orient("left") .ticks(5);同样设置起始坐标
//Create Y axissvg.append("g") .attr("class", "axis") .attr("transform", "translate(" + padding + ",0)") .call(yAxis);效果:
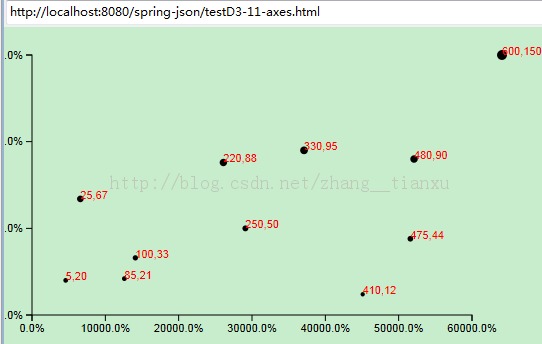
var formatAsPercentage = d3.format(".1%");
xAxis.tickFormat(formatAsPercentage);
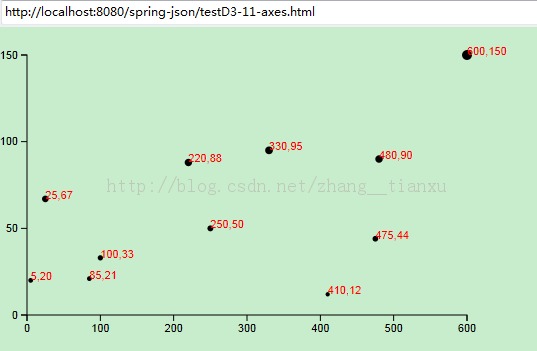
<!DOCTYPE html><html> <head><meta charset="utf-8"><title>testD3-11-axes.html</title><script type="text/javascript" src="http://localhost:8080/spring/js/d3.v3.js"></script><style type="text/css">.axis path,.axis line {fill: none;stroke: black;shape-rendering: crispEdges;}.axis text {font-family: sans-serif;font-size: 11px;}</style></head><body><script type="text/javascript">//Width and heightvar w = 500;var h = 300;var padding = 20;var dataset = [[5, 20], [480, 90], [250, 50], [100, 33], [330, 95],[410, 12], [475, 44], [25, 67], [85, 21], [220, 88],[600, 150] ];//Create scale functionsvar xScale = d3.scale.linear() .domain([0, d3.max(dataset, function(d) { return d[0]; })]) .range([padding, w - padding * 2]);var yScale = d3.scale.linear() .domain([0, d3.max(dataset, function(d) { return d[1]; })]) .range([h - padding, padding]);var rScale = d3.scale.linear() .domain([0, d3.max(dataset, function(d) { return d[1]; })]) .range([2, 5]);var formatAsPercentage = d3.format(".1%");//设置刻度的格式//Create SVG elementvar svg = d3.select("body").append("svg").attr("width", w).attr("height", h);svg.selectAll("circle") .data(dataset) .enter() .append("circle") .attr("cx", function(d) { return xScale(d[0])+30;//设置原点坐标,以及横轴位移量 }) .attr("cy", function(d) { return yScale(d[1]); }) .attr("r", function(d) { return rScale(d[1]); });svg.selectAll("text") .data(dataset) .enter() .append("text") .text(function(d) { return d[0] + "," + d[1]; }) .attr("x", function(d) { return xScale(d[0])+30; }) .attr("y", function(d) { return yScale(d[1]); }) .attr("font-family", "sans-serif") .attr("font-size", "11px") .attr("fill", "red");//Define X axisvar xAxis = d3.svg.axis() .scale(xScale) .ticks(5)//最多刻度数,连上原点 .orient("bottom") .tickFormat(formatAsPercentage);//添加刻度格式//Define Y axisvar yAxis = d3.svg.axis() .scale(yScale) .orient("left") .ticks(5) .tickFormat(formatAsPercentage);//Create X axissvg.append("g").attr("class", "axis").attr("transform", "translate(0," + (h - padding) + ")")//设置据下边界的距离.call(xAxis);//Create Y axissvg.append("g").attr("class", "axis").attr("transform", "translate(" + padding + ",0)")//设置轴据左边界的距离.call(yAxis);</script></body></html>